Debug production failures with confidence.
PathFlow investigates production errors, traces execution paths, isolates root causes with evidence, and helps you get to a fix faster.
Real engineering tooling for production agents.
Explore high-resolution captures of the live PathFlow platform—from real-time execution waterfall traces to automated root cause investigations.
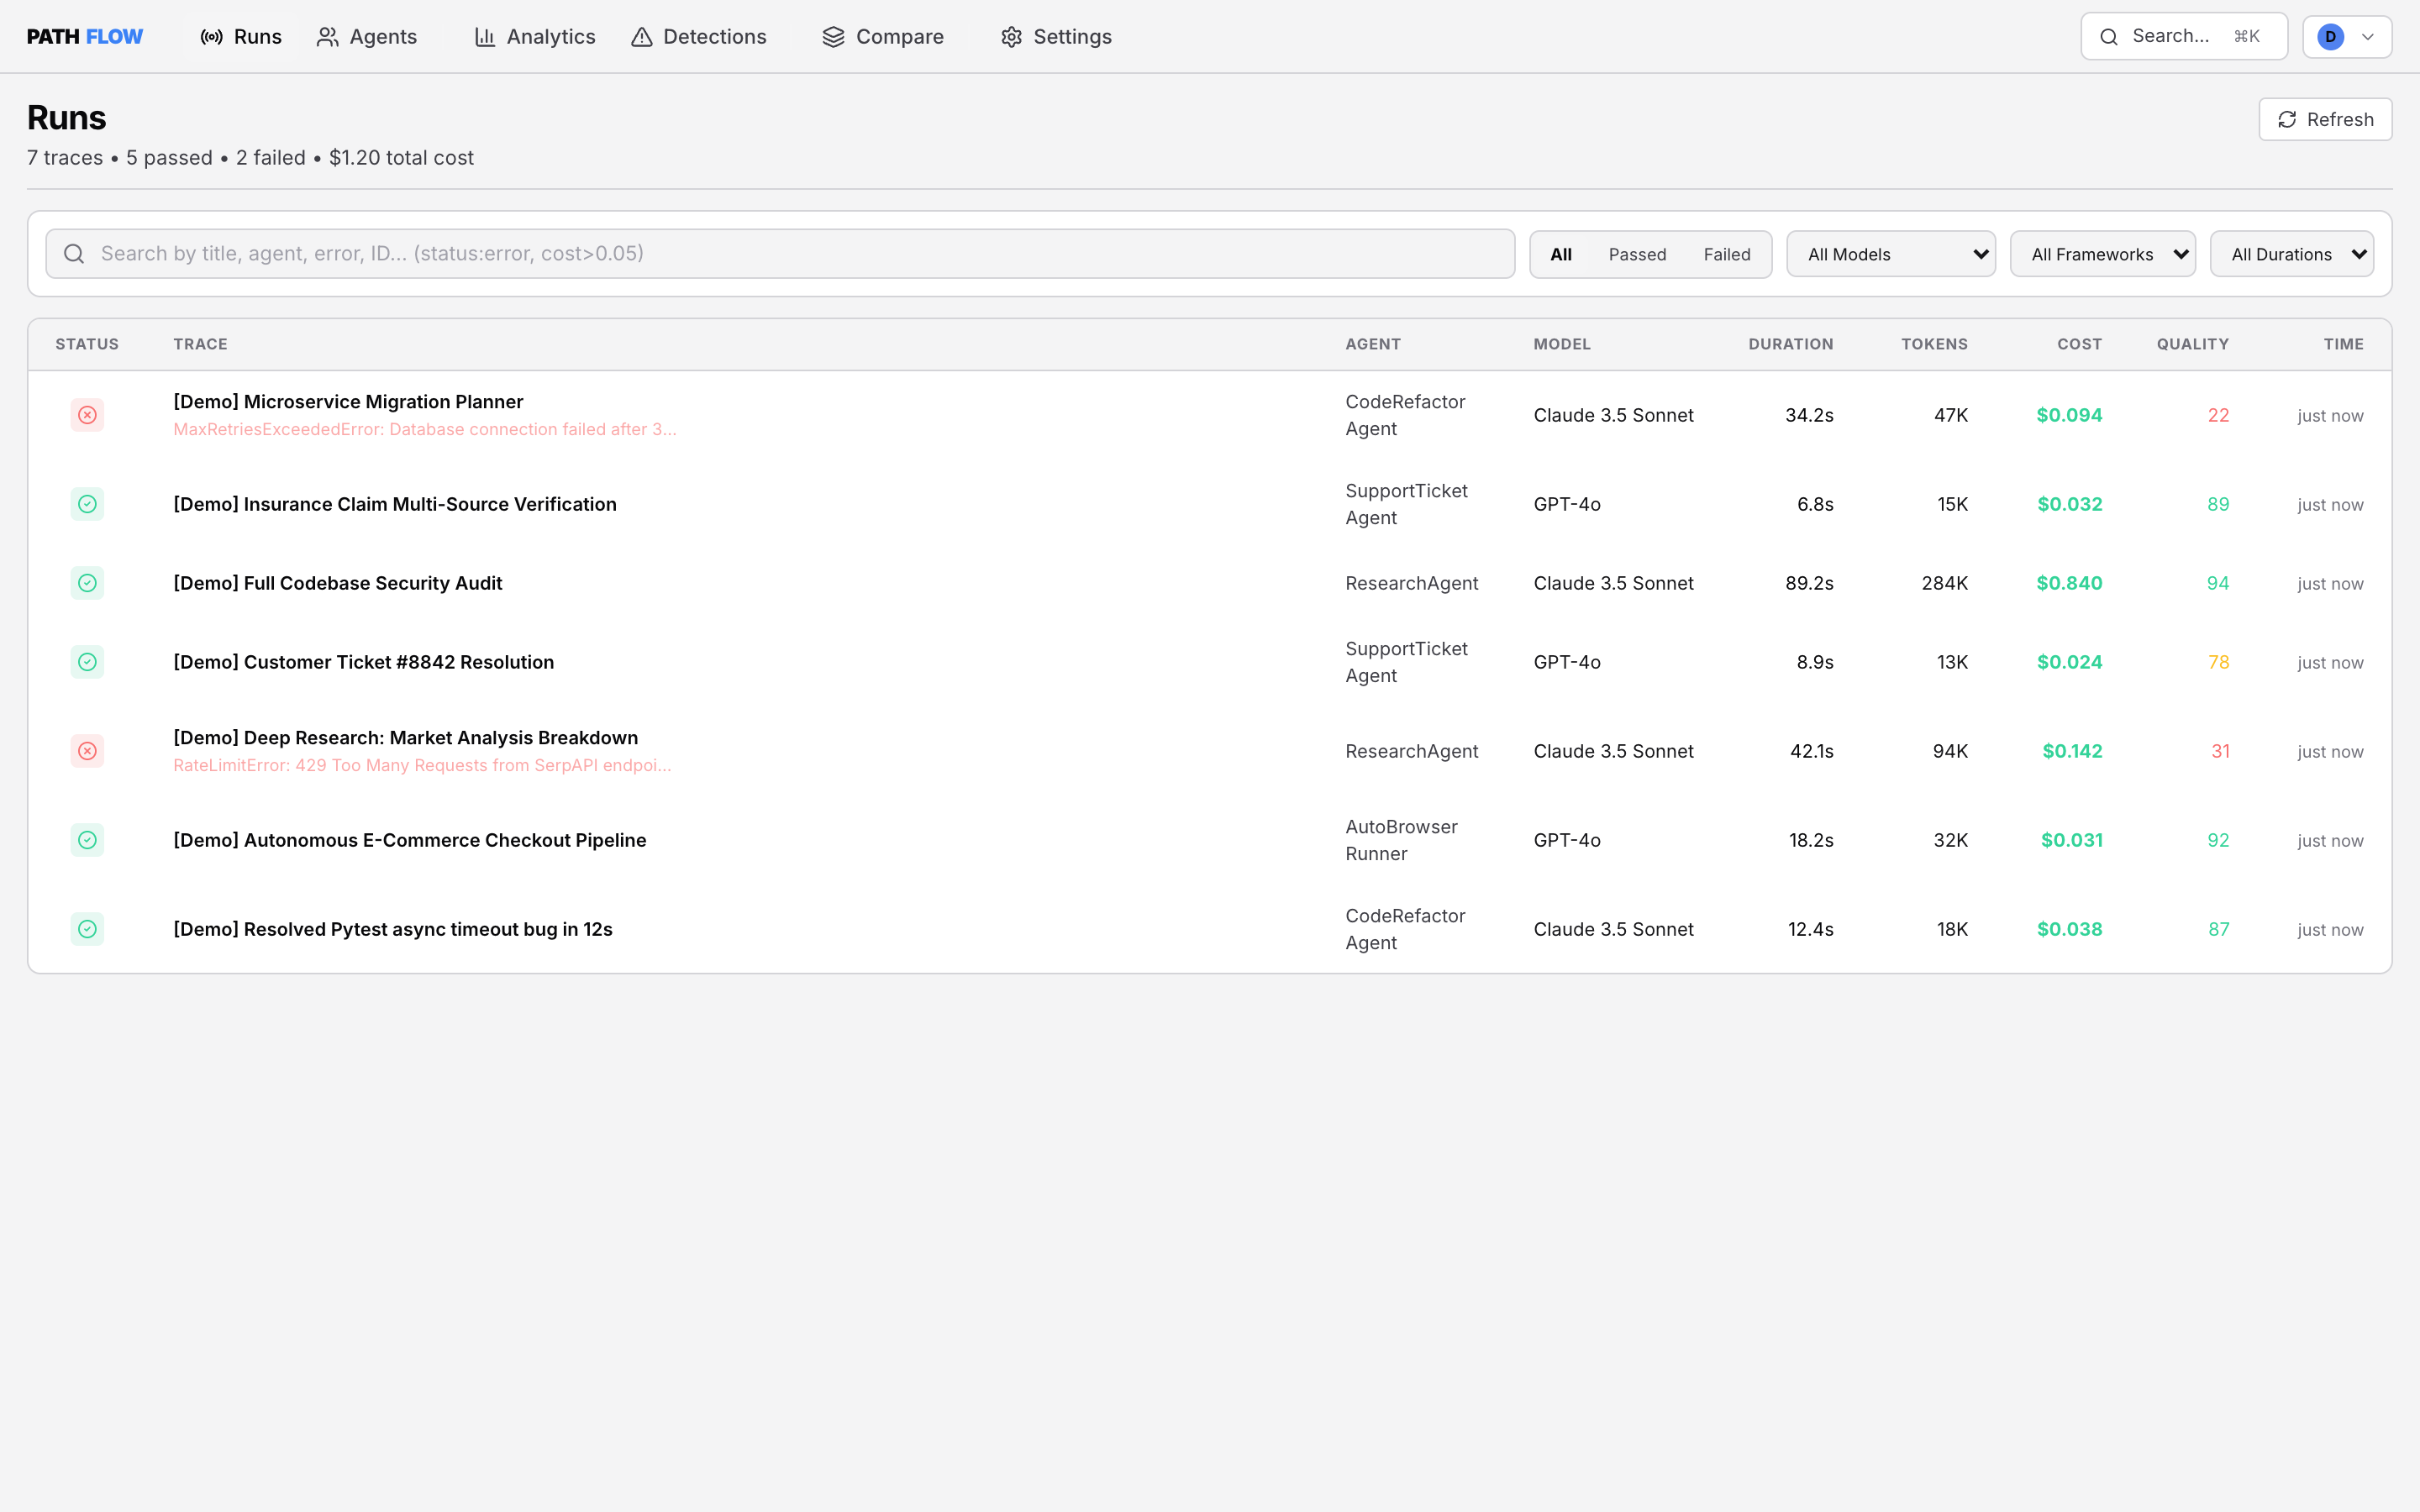
Real-Time Execution Runs & Token Economics
See every production execution in one place. Monitor status, model family, duration, token usage, and quality scores at a glance.
Built around the signals engineers already use to debug production
Production failures rarely have one obvious cause.
When something breaks in production, context is scattered across half a dozen tools.
PathFlow connects that context into a single investigation.
Instead of jumping between disconnected dashboards, PathFlow automatically correlates runtime telemetry, execution paths, and recent code changes to determine exactly why your system failed.
From production failure to root cause.
How PathFlow isolates issues step-by-step.
Production failure happens
An unhandled exception, HTTP 500, or tool timeout triggers automatic telemetry capture.
Collects relevant context
Captures runtime stack frames, variable state, span latencies, and deployment metadata.
Reconstructs execution path
Builds the step-by-step DAG of function calls, database queries, and external API requests.
Isolates root cause
Identifies the exact bug with verifiable telemetry evidence and confidence ratings.
Moves toward a fix
Proposes the code patch or configuration adjustment needed to resolve the incident permanently.
See what happened, not just that it failed.
Switch between real production scenarios to see how PathFlow diagnoses incidents.
Engineered for rapid production diagnosis.
Everything you need to turn raw failures into actionable fixes.
Understand every execution
See what happened across the entire request or workflow. Trace complex multi-step pipelines from initial HTTP request to internal function calls.
Investigate failures automatically
Bring logs, traces, errors, stack frames, and runtime variable context together into a unified incident investigation without manual log writing.
Find the root cause
PathFlow correlates evidence and isolates the exact failure point with high confidence, distinguishing symptoms from the true root cause.
Understand recent changes
Connect runtime failures directly with recent Git commits, code migrations, and deployment revisions that introduced the regression.
Reconstruct failures step-by-step
Turn production exceptions into concrete debugging paths you can inspect, step through, and compare with successful baseline runs.
Get to a fix faster
Move directly from diagnosis toward an actionable code change with concrete diff patches ready for developer review and verification.
Works with the systems your team already runs.
Zero migration needed. PathFlow instruments your Python microservices, FastAPI backends, or agentic frameworks in 2 lines of code.
import pathflow

# 1. Initialize PathFlow client
pathflow.init(
    api_key="pf_live_secret_key",
    endpoint="https://thepathflow.online/app/api/v1"
)

# 2. Trace critical execution paths automatically
@pathflow.trace()
def process_checkout(user_id, cart):
return billing_service.charge(user_id, cart)Observability tells you something is wrong.
PathFlow helps you debug why.
Traditional dashboards aggregate metrics. PathFlow reconstructs individual failures with code context.
Built for the people who own production.
Designed for developers and engineering teams operating real production systems.
Backend Engineers
Triage elusive 500s, database deadlock spikes, and external service timeout cascades without manual reproduction steps.
Full-Stack Teams
Connect user-facing frontend error reports directly to the downstream API call and database query that caused the breakdown.
AI & Agent Teams
Inspect multi-step LLM chains, diagnose tool schema mismatches, prompt drift, token cost spikes, and execution loops.
Startup Teams
Slash incident MTTR so your small team can spend time building customer features rather than digging through log archives.
Simple, transparent plans in Indian Rupees.
Start free for personal prototypes. Upgrade seamlessly as your team scales.
Free Developer
For personal projects, solo experimentation, and small prototypes.
- 1 Active Project
- 500 Runs / month
- 7-day Trace Retention
- Basic Error Logging & Spans
- Python & TypeScript SDKs
- Community Discord Support
Pro Engineer
For developers and creators running autonomous agents in production.
- Unlimited Projects
- 10,000 Runs / month
- 30-day Trace Retention
- Root Cause Investigation
- Automated Failure Detections
- Git Diff & Commit Attribution
- Priority Email & Chat Support
Engineering Team
For engineering teams debugging complex multi-agent workflows together.
- 5 Included Team Seats
- 50,000 Runs / month
- 90-day Trace Retention
- Real-time Incident Webhooks & Slack Alerts
- Multi-Agent Comparative Profiler
- Custom Alerting Thresholds
- Dedicated Slack Channel Support
Enterprise
For high-scale enterprises with custom volume, compliance, and SLA needs.
- Unlimited Runs & Team Seats
- 365-day Custom Data Retention
- Self-Hosted VPC / Dedicated On-Premises
- SOC2 Type II & HIPAA Compliance
- Custom SSO (SAML, Okta, Azure AD)
- 99.99% Uptime SLA Guarantee
- Dedicated Solutions Architect
Your next production bug is going to happen.
Make figuring it out faster. Connect your stack in minutes.
Get started with free developer tier · Full access to investigation dashboard